To reduce the pollution that causes climate change, Minnesota has set goals to cut our collective greenhouse gas (GHG) emissions. The bipartisan 2007 Next Generation Energy Act set statutory benchmarks to reduce GHG emissions 15% from 2005 levels by 2015, 30% by 2025, and 80% by 2050. In 2023, the Minnesota Legislature adopted new goals included in Minnesota’s Climate Action Framework to reduce emissions 50% by 2030 and achieve net-zero emissions by 2050.
The latest data shows greenhouse gas emissions in Minnesota have dropped 14% between our 2005 baseline and 2022.
The COVID-19 pandemic changed how Minnesotans lived and worked in 2020 and 2021, reducing emissions. As Minnesotans returned to pre-pandemic routines, emissions that dropped steeply in 2020 rebounded, reflecting a national trend. The state saw a 6.4% increase in emissions between the end of 2020 and the end of 2022. Despite the rebound, emissions from sectors like transportation, electricity generation, and agriculture remain below 2019 levels.
Check out Minnesota’s Climate Action Framework to learn more about our plans to address and prepare for climate change.
- Inventory of greenhouse gas emissions: 2005 to 2022
- Data: Look at individual sectors in more detail, download summary data, and see other trends
Transportation
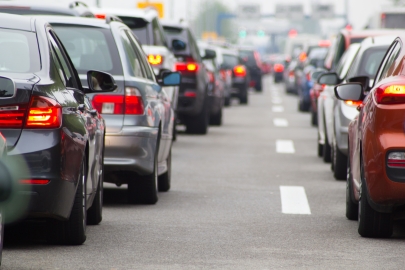
The transportation sector remains Minnesota’s largest source of GHGs, accounting for about 29% of the state’s emissions. Emissions from planes and light-duty trucks (including pickup trucks, minivans, and SUVs) increased after the height of the pandemic in 2020 but remain below pre-pandemic levels. In contrast, emissions from heavy-duty trucks (including delivery vans, large commercial vehicles, and tractor-trailers) are now higher than they were in 2019.
Agriculture
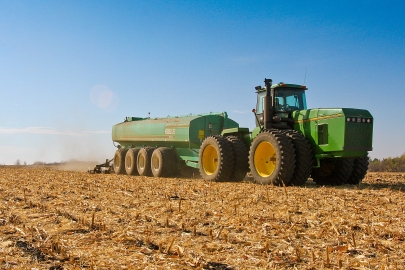
Agriculture is Minnesota’s second-largest source of emissions, accounting for about 25% of the state’s GHGs. While net emissions from Minnesota agriculture have not changed significantly since 2005, improved efficiency and sustainable agriculture practices have kept emissions from rising as Minnesota farms produce more food, biofuel, and fiber. The state is making investments to support farmers in adopting sustainable agricultural practices that will reduce emissions from this sector.
Electricity generation
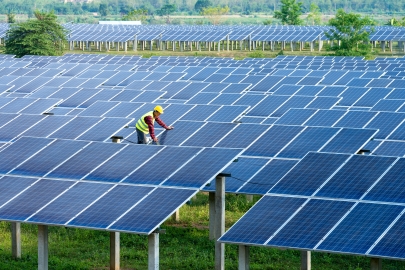
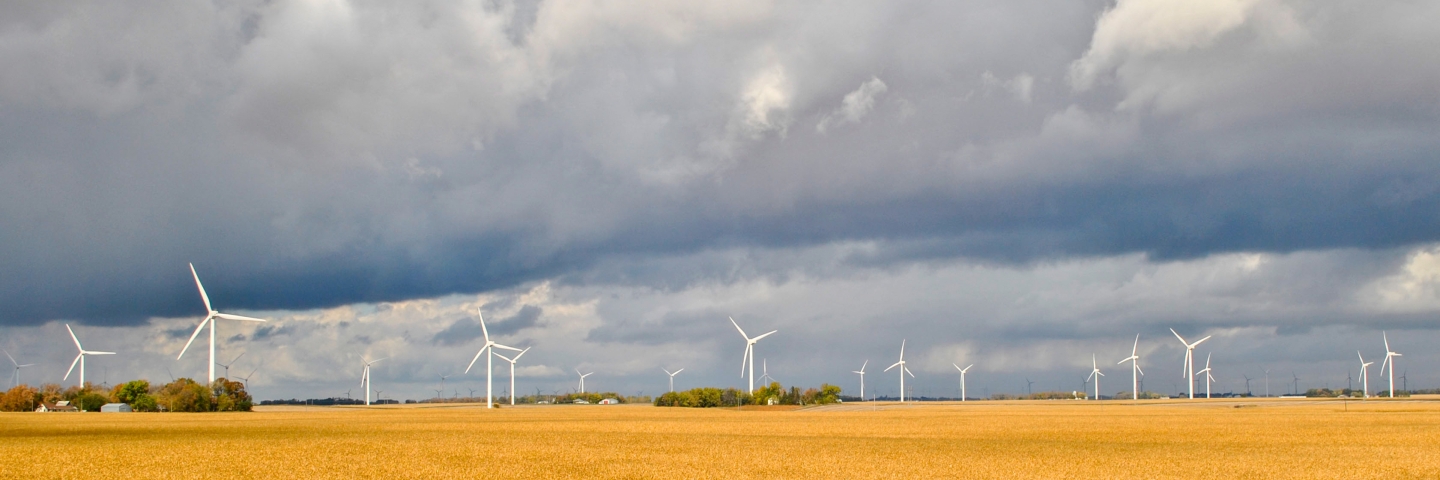
Emissions from Minnesota’s electricity generation, which accounts for 20% of Minnesota’s GHGs, have declined significantly in recent years. These declines are a result of the transition from coal to renewable energy, a trend that is continuing with investments in clean energy sources such as wind and solar. In 2023, the Minnesota Legislature adopted a new Clean Electricity Standard that requires electric utilities to provide 100% carbon-free electricity by 2040.
Industrial
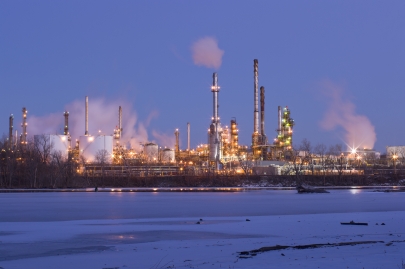
Minnesota’s industrial sector is now the fourth-largest source GHGs in Minnesota and accounts for 18% of the state’s emissions. These emissions are mostly generated from burning fossil fuels at facilities for industrial processes. Emissions from electricity use in this sector are accounted for under the electricity generation sector. Rising emissions from the industrial sector are a result of the increased use of natural gas and for industrial processes.
Residential

The residential sector is the fifth-largest source of GHG emissions in Minnesota, accounting for about 8% of the state’s emissions. Emissions from Minnesota homes and apartment buildings have increased 38% over the past 17 years. The largest source of these emissions is natural gas used for home heating and appliances.
Commercial
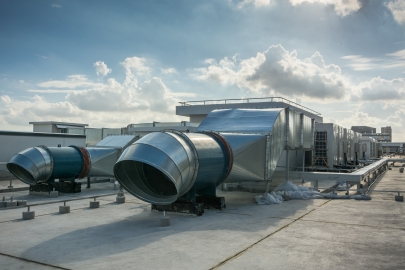
The commercial sector is the sixth-largest source of greenhouse gas emissions in Minnesota, accounting for about 7% of the state’s net emissions. Emissions from the commercial sector are mainly driven by burning natural gas to heat buildings. This sector includes buildings that house businesses and public entities like schools and local governments. Since 2005, emissions from the commercial sector increased by 48%.
Waste
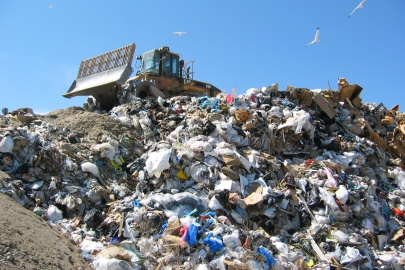
The waste sector produces about 1% of GHG emissions annually in Minnesota. Compared to the 2005 baseline, GHG emissions from the waste sector have decreased by about 40%. These emissions come from energy used in waste processing, incinerator fuels, waste incineration, and methane gas from landfills and wastewater treatment.
Land use, land-use change, and forestry

In 2025 the state’s greenhouse gas inventory separated the land use, land-use change, and forestry sector from agriculture. This sector is a carbon sink (i.e., they absorb more carbon dioxide from the atmosphere than they release), resulting in net negative emissions of 11.6 million metric tons of CO2-e in 2022, offsetting 8.4% of all other emissions in the state. The rate of net sequestration has increased by about 20% since 2005, a trend largely driven by the growth and expansion of Minnesota’s forests.
More information
- Greenhouse gas emissions data: Look at individual sectors in more detail, download summary data, and see other trends.
- Inventory of greenhouse gas emissions: 2005 to 2022
- Climate change is already impacting Minnesota. Learn more about our climate trends from the DNR Office of Climatology.