Nitrogen is a key pollutant in state waters and its concentrations in both surface and groundwater have been increasing over time. The MPCA released a report on nitrogen pollution in 2013, indicating that agricultural fields using artificial subsurface drainage (drain tile) are a key source of nitrogen pollution to lakes and streams. Nitrate (a form of nitrogen) in lakes, rivers, and streams is toxic to fish and other aquatic life; in drinking water, it's potentially harmful to humans. Proposed reductions in nitrogen will benefit both Minnesota waters and water downstream from us, particularly the oxygen-depleted “dead zone” in the Gulf of Mexico.
The MPCA conducted a study of nitrogen in surface waters so that we can better understand the nitrogen conditions in Minnesota’s surface waters, along with the sources, pathways, trends and potential ways to reduce nitrogen in waters.
What is the issue?
The MPCA’s study shows elevated nitrate levels, particularly in the southern third of Minnesota.

Why is it important?
- Elevated nitrate levels may harm fish and aquatic life.
- Because nitrate moves primarily via groundwater (not surface runoff), it can pollute drinking water wells.
- Nitrate leaving Minnesota via the Mississippi River contributes to the oxygen-depleted dead zone in the Gulf of Mexico.
Where does nitrate come from?
More than 70% of the nitrate is coming from cropland, the rest from regulated sources such as wastewater treatment plants, septic and urban runoff, forest, and the atmosphere.
- Municipal wastewater contributes 9% of the statewide nitrate load.
- Nitrate leaching into groundwater below cropped fields and moving underground until it reaches streams, contributes an estimated 30% of nitrate to surface waters,

How does nitrate move from cropland into our water?
- The amount of nitrate reaching surface waters from cropland varies tremendously, depending on the type of crops, tile drainage practices, cropland management, soils, climate, geology and other factors.
- Tile drainage is the highest estimated cropland source pathway.
- Precipitation amounts have a pronounced effect on nitrate loads. During a dry year, loads may drop by 49% compared to an average year, however during a wet year, overall loads may increase by 51%.
- Nitrate concentrations and loads are high throughout much of southern Minnesota, resulting largely from leaching through large parts of intensively cropped soils and into underlying tile drains and groundwater.
- Cropland sources account for an estimated 89 to 95% of the nitrate load in the Minnesota, Missouri, and Cedar Rivers, and Lower Mississippi River basins.

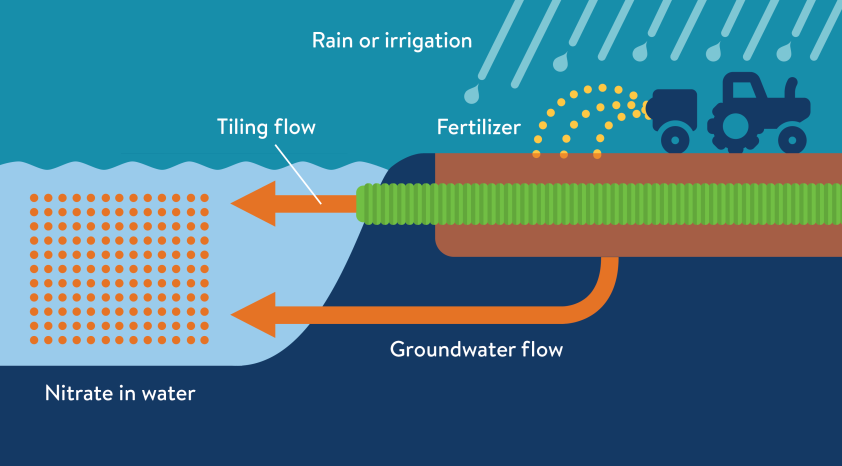
Tile drainage pathway
In tiled cropland, most of the rainwater that ends up in surface water (ditches, streams) flows through tile drainage. This water can be high in nitrate, but it is also potentially easier to control.
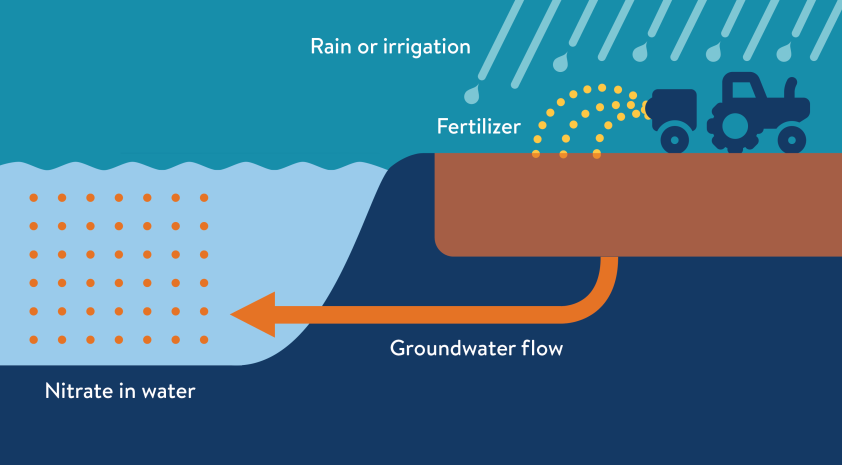
Groundwater pathway
In cropland without tile drainage, most rainwater flows through the ground to get to surface waters. As it travels through the earth, some of the nitrate is removed, resulting in less nitrate reaching our streams and rivers. However, there are fewer options of controlling this kind of nitrate pollution once it moves below the crop roots.
Where does the nitrate go?
- Groundwater nitrate can take from hours to decades to reach surface waters.
- The highest nitrate-yielding watersheds are Cedar, Blue Earth and Le Sueur in south-central Minnesota.
- The Minnesota River adds twice as much nitrate to the Mississippi River as the combined loads from the Upper Mississippi and St. Croix Rivers.
- On average, 158 million pounds of nitrate leaves Minnesota per year in the Mississippi River — 75% comes from Minnesota watersheds.
- Nitrate concentrations have steadily increased in the Mississippi River since the mid-1970s.
- Nitrate loads leaving Minnesota via the Mississippi River contribute to the oxygen-depleted “dead zone” in the Gulf of Mexico (currently estimated to be the size of Massachusetts). The dead zone cannot support aquatic life, affecting commercial and recreational fishing and the overall health of the Gulf.
How do we reduce the nitrate going into surface waters?
Tactics for reducing cropland nitrate going into surface waters fall into three categories:
- Manage in-field nutrients (i.e., optimize fertilizer rates, apply fertilizer closer to timing of crop use)
- Manage and treat tile drainage water (i.e., plan tile spacing and depth; control drainage; construct and restore wetlands for treatment purposes; and bioreactors)
- Diversify vegetation/landscape (i.e., plant cover crops; plant more perennials on marginal cropland)
Nitrate fertilizer efficiency has improved during the past two decades. While further refinements in fertilizer rates and application timing can be expected to reduce nitrate loads by roughly 13% statewide, additional and more costly practices will also be needed to make further reductions and meet downstream needs. Statewide reductions of more than 30% are not realistic with current practices.
To see progress, nitrate leaching reductions are needed across large parts of southern Minnesota, particularly on tile-drained fields and row crops over thin or sandy soils. Only collective incremental changes by many over broad acreages will result in significant nitrogen reductions to downstream waters.
What’s next?
A state-level nutrient reduction strategy is being developed to address Minnesota’s contribution to the Gulf of Mexico’s hypoxia issue. Minnesota contributes the sixth highest nitrogen load to the Gulf. The strategy will identify how further progress can be made to reduce nitrate and phosphorus entering both in-state and downstream waters.
The MPCA is also working with the U.S. Environmental Protection Agency and other states to evaluate the effect nitrate has on aquatic life in order to develop and adopt toxicity standards.
About the study
The study was a collaborative effort led by Minnesota Pollution Control Agency, with assistance from the University of Minnesota and the U.S. Geological Survey. The report team used more than 50,000 water samples collected at 700 stream sites and used 35 years of monitoring data and findings from 300 published studies.
Report
Nitrogen in Minnesota Surface Waters
Nitrogen in Minnesota Surface Waters: Executive Summary
Nitrate in Surface Waters Fact Sheet
Individual chapters
Chapter A1. Background — Purpose and Approach
Chapter A2. Background — Nitrogen in Waters — Forms and Concerns
Chapter B1. Conditions — Monitoring Stream Nitrogen Concentrations
Chapter B2. Conditions — Monitoring Mainstem River Nitrogen Loads
Chapter B3. Conditions — Monitoring HUC8 Watershed Outlets
Chapter B4. Conditions — Modeled Nitrogen Loads (SPARROW)
Chapter B5. Conditions — Nitrogen Transport, Losses and Transformations within Minnesota Waters
Chapter C1. Trends — Nitrate Trends in Minnesota Rivers
Chapter C2. Trends — Nitrogen Trend Results from Previous Studies
Chapter D1. Nitrogen Source Assessment — Sources of Nitrogen - Results Overview
Chapter D2. Nitrogen Source Assessment — Wastewater Point Source Nitrogen Loads
Chapter D3. Nitrogen Source Assessment — Atmospheric Deposition of Nitrogen in Minnesota Watersheds
Chapter D4. Nitrogen Source Assessment — Nonpoint Source Nitrogen Loading, Sources, and Pathways for Minnesota Surface Waters
Chapter E1. Verification of Source Assessment — Comparing Source Assessment with Monitoring and Modeling Results
Chapter E2. Verification of Source Assessment — Evaluating River Nitrogen with Watershed Characteristics
Chapter E3. Verification of Source Assessment — Other Studies of Nitrogen Sources and Pathways
Chapter F1. Reducing Nitrogen Loads to Surface Waters — Reducing Cropland Nitrogen Losses to Surface Waters
Chapter F2. Reducing Nitrogen Loads to Surface Waters — Reducing Wastewater Point Source Nitrogen Losses to Surface Waters
Chapter G. Conclusions
Appendices 1-7
Ammonia
Ammonia is a form of nitrogen that is directly toxic to aquatic life. It comes from wastewater treatment plants and animal waste or air pollution and runoff from agricultural land. Water with high concentrations of ammonia allow the chemical to build up in the tissues and blood of fish, and can kill them.
Contact
David Wall
Minnesota Pollution Control Agency
david.wall@state.mn.us
651-757-2806
For more information
For more information about what Minnesota is doing to reduce nutrients in our waters:
- Nutrient reduction strategy
Minnesota Nitrogen Fertilizer Management Plan (Minn. Department of Agriculture)
Minnesota Agricultural Water Quality Certification Program
Developing Surface Water Nitrate Standards and Strategies for Reducing Nitrogen Loading
Mississippi River/Gulf of Mexico Watershed Nutrient (Hypoxia) Task Force