Controlling phosphorus is an important part of protecting Minnesota waters. Under natural conditions, phosphorus is typically scarce in lakes and streams, but the past 100 years of human activities have resulted in excessive loading of phosphorus into many freshwater systems. Phosphorus promotes growth of suspended algae, particularly in lakes and larger rivers, turning them green and in serious cases suffocating fish and other aquatic life. Phosphorus is released from both regulated and non-regulated sources.
Minnesota’s eutrophication standards
In 2015, Minnesota approved river eutrophication standards, the intent of which is to protect aquatic life from the negative impacts of excess suspended algae in rivers and streams. State lake eutrophication standards were approved in 2008. Learn more:
Also in 2015, the MPCA began evaluating the need for phosphorous limits in NPDES/SDS permits on a watershed basis. This approach accounts for all contributors of phosphorus within a major watershed, and sets phosphorous effluent limits for all of a watershed's wastewater facilities at one time, rather than one-by-one as permits come up for reissuance. This ensures that all the contributors are doing their “fair share” of reducing phosphorus, and is consistent with the agency's watershed approach to water monitoring and protection.
Nutrient loads and flow volumes
Tool shows estimations of nitrogen and phosphorus discharge from wastewater treatment facilities around Minnesota.
Procedures for developing phosphorus limits
Phosphorus limits are based on the potential of a facility to contribute to a downstream water that exceeds lake or river eutrophication standards. The analysis and calculations used to establish necessary phosphorus effluent limits:
For most pollutants, limits are based on conditions in the immediate receiving water. For eutrophication, limits may be reviewed on the basis of water quality in a number of downstream waters. It is not uncommon for multiple facilities to discharge upstream of an individual river reach or lake exceeding or potentially exceeding the standard. In the watershed approach to phosphorous limits, various watershed complexities are evaluated at one time so limits will protect all waters in the watershed.
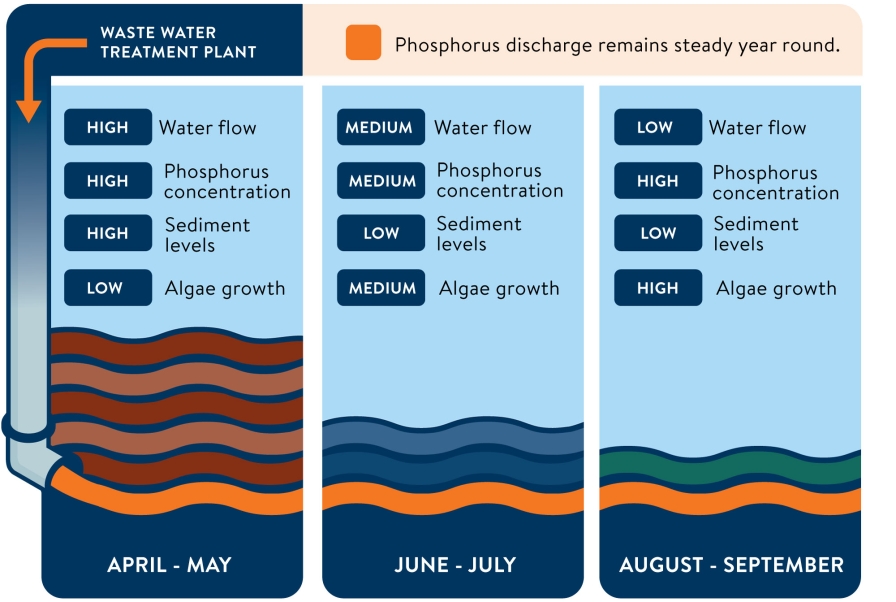
The concentration of phosphorus and algae in a river often vary depending on flow. At high flow, the proportion of effluent to stream water can be relatively low. Most phosphorus loading comes from nonpoint sources such as stormwater runoff or stream bank erosion. Phosphorus concentrations can be very high for limited periods but turbulent conditions, short residence times, and shading from sediment often prevent excess algae growth. At low flow, the proportion of effluent to stream flow can be much higher. Point sources like wastewater treatment facilities can dominate in-stream phosphorus loading. Low flow conditions often occur in late summer months when temperatures are higher and water is moving slower, all of which tend to encourage algae growth. Because of this relationship between flow, phosphorus, and algae, treatment plant effluent limits are often derived from a moderate low flow critical condition. In this way, limits are more capable of providing protection over the average of all summer days.
History of wastewater phosphorus reductions
Minnesota has had point-source effluent limits for phosphorus since the early 1970s. In 2000, the MPCA Citizens' Board adopted a strategy for addressing phosphorus in NPDES permits. Phosphorus loads were reduced by 54% from 2000 to 2009 and have continued to decline.
- The 2014 total phosphorus load for the state was 605,000 kilograms, down 17% from the 2011-12 average of 729,000 kilograms.
- The annual phosphorus load has been reduced by 67% from the 2000-01 baseline of 1,855,000 kilograms per year.